
MONTHLY REGIONAL GVA INDICATOR
Official ONS regional Gross Value Added (GVA) estimates are typically published in April each year. The most recent estimates are available for the year 2023, i.e. published with a two year lag.
Our Weighted Industry Mix (WIM) method aims to provide timely regional GVA growth indicators that appear at the same time as the UK monthly GVA release. The method accounts for regional differences in detailed industry structure and, from October 2025 (August GVA), incorporates elements of ‘nowcasting’. See here for notes on performance and method.
LATEST DATA
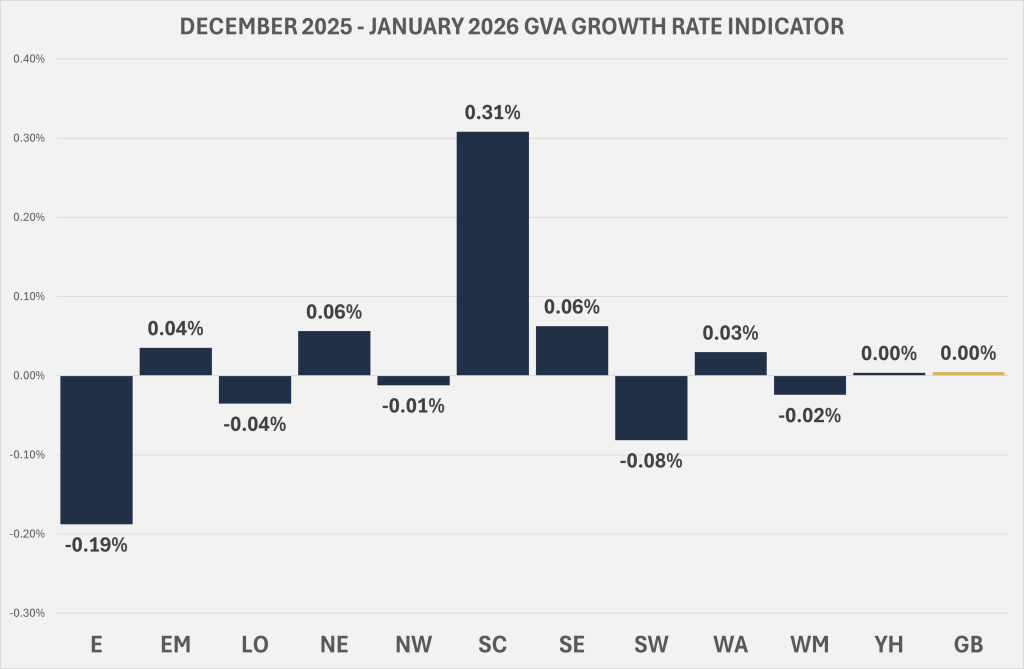
The January 2026 WIM estimates for ITL1 regions suggest some degree of variation around flat GB growth. Scotland was estimated to have grown by around 0.3%, with construction, alcohol production and the retail trade supporting growth. In contrast, the East of England saw an approximate 0.2% fall in growth, with employment services, electrical equipment and rental services contributing most to the decline in growth. Most other regions performed close to the GB average.
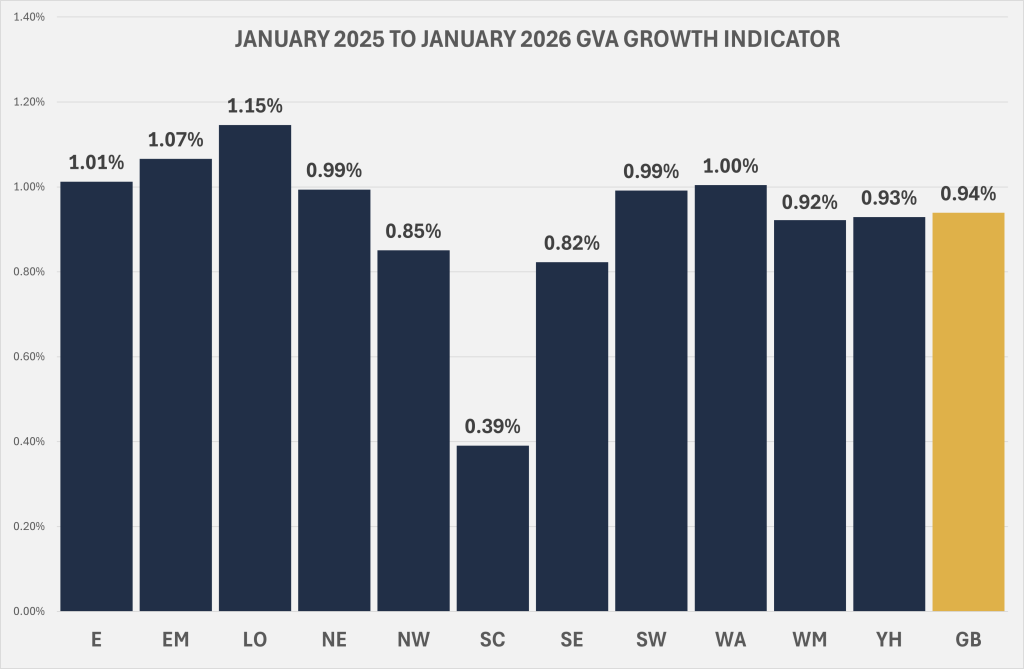
The chart below illustrates the growth between January 2025 and January 2026. This puts GB growth between time points at 0.94%, with London (1.15%) marginally outperforming that rate, and Scotland (0.4%) lagging behind.
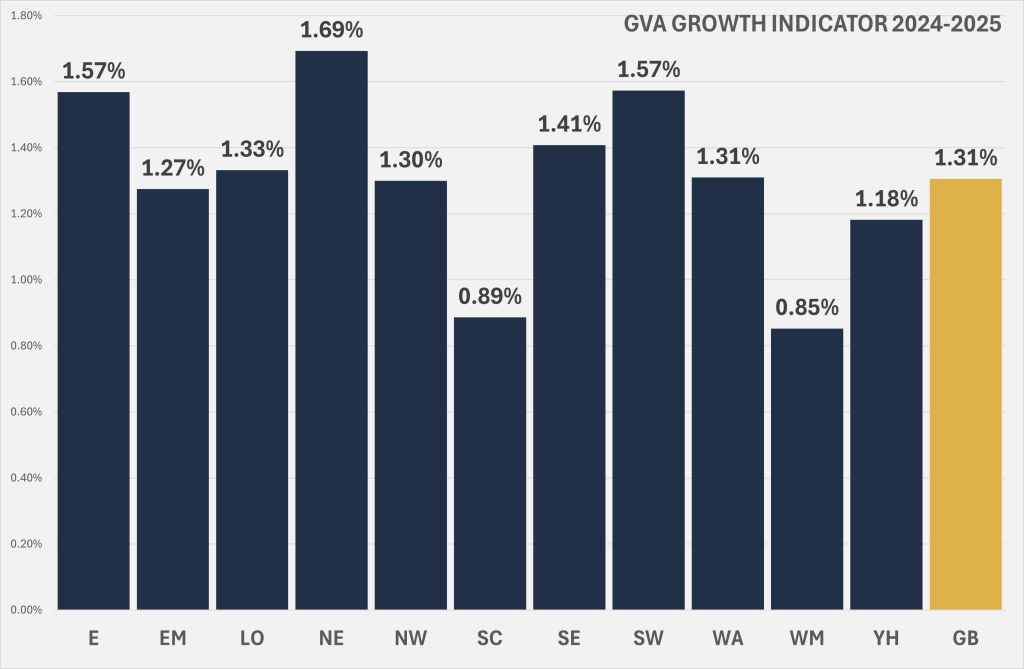
Looking at the estimated annual 2024-2025 growth rate suggests a GB growth rate at around 1.3%. The North East (1.69%) outperformed GB growth with pharmaceuticals a significant contributor. This was also the case in the East (1.57%) and South West (1.57%) with health services also a growth contributor in those regions.
NEXT UPDATE : on or around 16 April 2026
2024-25 GVA Growth Indicator
WIM GROWTH INDICATOR MONTHLY FOR 2025
The charts below show how regions have performed during 2025 and 2026 on on a monthly basis. In the first chart you can select either an individual month, or multiple months to show approximate cumulative growth in the months you select.
The second chart tracks the monthly growth rate since 2025 between a selected region and GB.
THE WIM GVA INDICATOR IN 2024
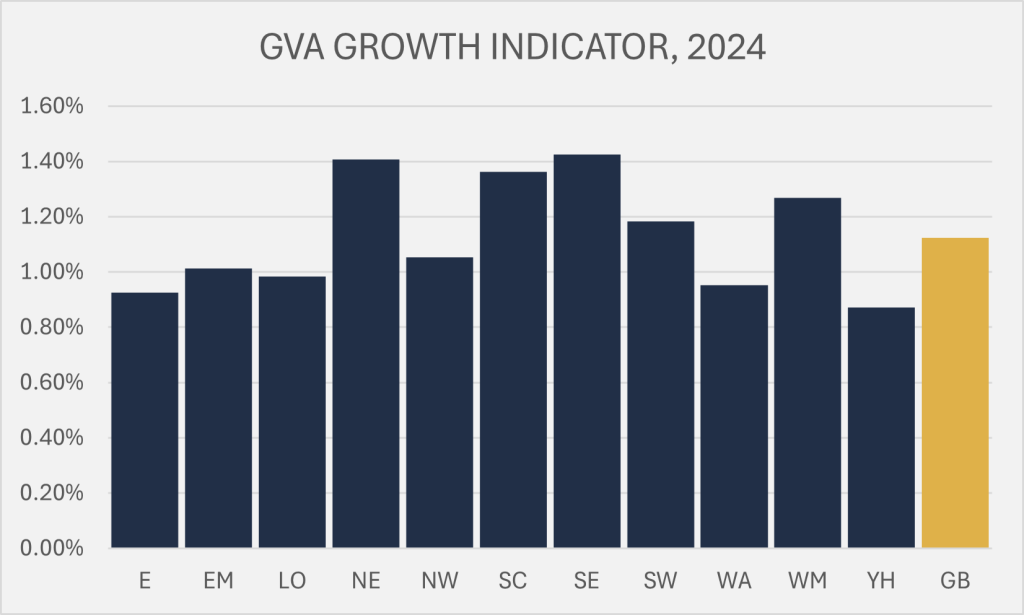
The chart below shows the implied growth rate in GVA between 2023 (ONS latest estimate) and 2024. The SE (1.42%), NE (1.41%) and Scotland (1.36%) are amongst those estimated to have outperformed the GB average of 1.12%, whilst Yorkshire and Humberside (0.87%), Wales (0.95%) and the East (0.93%) were amongst the lagging regions.
For the SE, growth came from industries such as computer products and health services; the NE was significantly boosted by the health sector, pharmaceuticals and construction. In Scotland the health sector led growth whilst Yorkshire & Humberside, Wales and the East were mostly held back by education services.
HOW RELIABLE IS WIM? STATISTICAL PROVENANCE 2016-2023, AND TECHNICAL NOTES ON METHOD
Each month, ONS provide indices of real GVA growth by detailed UK industry (100+ industries). The WIM method weights these indices for their importance at a regional level.
The basic concept is that, if aerospace grew significantly nationally in a given month, the inference is that this would be expected to contribute more significantly to growth in regions specialised in aerospace, such as the South West.
From October 2025 (i.e. the GVA release for August), the WIM method incorporates ‘nowcasting‘ elements. The nowcasting adjustments are applied to specific industries where the change in the index can be attributed to events in a particular region, or regions. For example, if production at a motor plant in a particular region was disrupted in the given month, the fall in the UK motor production index is more heavily apportioned to that region.
The charts below show how the WIM method has tracked official ONS estimates of GVA growth in each region over time. You can inspect any one region’s WIM projection v ONS over time, or look across the regional WIM projections vs ONS for any given year.
Is the WIM method informative? Statistically, yes – the 2023 WIM estimates for example explain around 50% of the variation in ONS regional growth rate (p=0.018) and the joint test across the whole sample, controlling for period fixed effects yields p=0.001, indicating strong statistical evidence that WIM tracks ONS growth rates in a meaningful way. However, the growth rate for any given industry at any point in time can of course vary between regions. WIM is therefore only a partial explanation / indicator of regional growth.
Essentially, the WIM indicator shows whether a region was relatively specialised in industries that grew or declined nationally in the period in question.
In this sense, a simple but interesting interpretation of the WIM estimate is that it represents expected regional growth, given the region’s industry structure. Differences between the WIM and ONS estimates can therefore be interpreted as representing under/over-performance of the region’s industries relative to the nation. This sort of interpretation is essentially the ‘shift-share‘ approach to analysing regional economic growth.
Technical Notes on Method
The historic ‘ONS’ regional growth rates reported here differ slightly to those published for the UK by ONS. This is principally due to WIM estimates being for GB not UK, but also partly due to total GVA being calculated over a different level of industry disaggregation between methods.
The WIM method is described briefly below.
Firstly the ONS chained volume estimates of GVA need to be de-linked because industry volume estimates tend to be progressively non-additive outside of the base year. In order to mitigate against this issue, single link Laspeyres indices are formed as follows.
For ONS estimates, the nominal industry GVA estimate in each industry i in year t is transformed into t-1 prices, e.g. for industry i, t at t-1 prices is the nominal GVA estimate in t-1 multiplied by the volume growth between t and t-1. The ONS volume growth rate is therefore the sum of GVA across all i industries in t at t-1 prices divided by the sum of GVA for all i in t-1 at t-1 prices.
The WIM indicator estimates are then formed by taking nominal GVA in industry i in t-1 and applying the national volume index growth rate in industry i between t and t-1. The estimated total volume growth rate between t and t-1 is therefore the estimated GVA in t aggregated across i industries, divided by the ONS nominal GVA total in t-1.
This method forms an ‘observed’ and estimated volume-based time series that can be aggregated across industries and is suitable for direct comparison between years.
PRODUCTS & SERVICES
You can see a more comprehensive list of our products and services here .
Check out our free-to-use economic impact analysis tool.
You can CONTACT us to discuss any product or service.