
HOW ENERGY INTENSIVE IS YOUR LOCAL ECONOMY?
Across the UK, the amount of energy required to generate £1m of Gross Value Added (GVA) varies widely – from service-dominated city centres to energy-intensive industrial heartlands.
Our interactive map lets you explore these differences at Local Authority District level between 2015 and 2023. You can see which areas have become more efficient over time, and where heavy industry continues to shape the local energy profile.
Data commentary along with method and data sources are set out below.
CONTACT us to discuss this analysis or any product or service.
COMMENTARY
How much energy does it take to generate £1m of Gross Value Added (GVA)? The answer varies hugely across the UK, and has shifted over time. Using industrial and commercial energy consumption divided by real GVA (expressed as kilo tonne of oil equivalent , ktoe per £1m GVA), we track local authority district (LAD) performance from 2015 to 2023.
GENERAL TRENDS
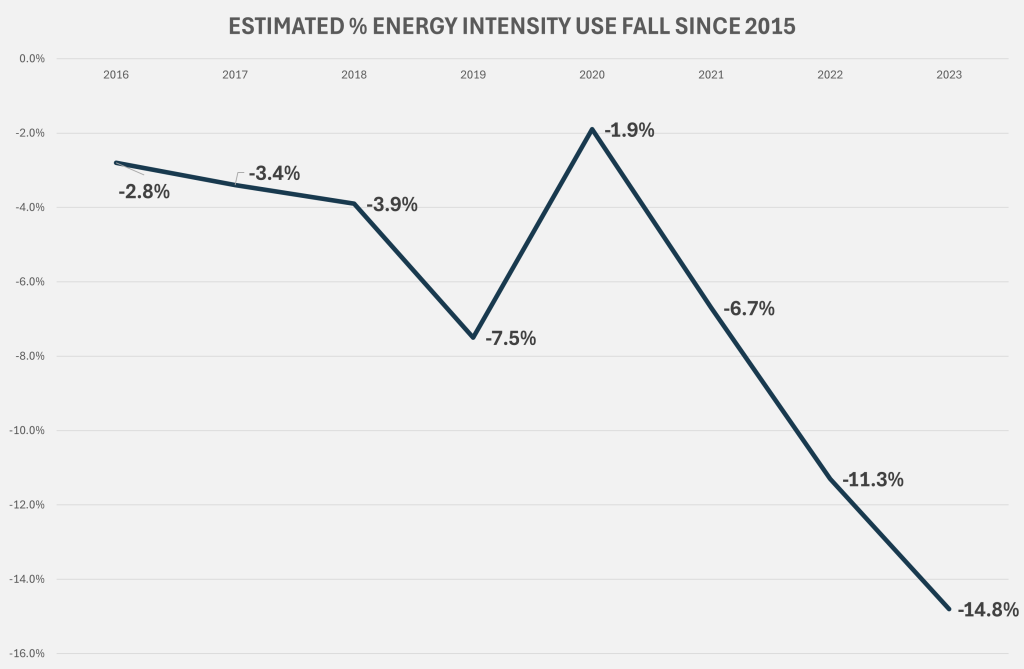
Our analysis finds that, generally, efficiency has improved steadily since 2015, with the most pronounced gains in 2022–23.
Estimated energy use intensity fell between 2016-2018 around 2.8-3.9%, reaching 7.5% in 2021. The 2020 pandemic saw a much smaller (but statistically significant, p=0.003) fall in intensity compared to 2015 of 1.9% as real GVA fell sharply relative to energy consumption. Since 2021 intensity of use has fallen markedly with relative gains of 11.3% in 2022 and 14.8% in 2023. The general downward trend likely reflects shifting industrial composition and the acceleration of energy efficiency technologies. The pronounced improvements in 2022/3 are perhaps more reflective of energy price shocks on firm behaviour.
Where is energy intensity highest and lowest in 2023?
The extremes tell a familiar story about Britain’s economic geography – a stark divide between service-oriented cities and industrial heartlands
Most energy-intensive in 2023 (highest kteo/£1m GVA):
- North Lincolnshire (0.293) and Pembrokeshire (0.310), both areas with heavy industry and energy facilities (steel in Scunthorpe, oil and gas terminals in Milford Haven).
- Falkirk (0.229) and Neath Port Talbot (0.191) are long associated with petrochemicals and steelmaking.
- High Peak (0.219) in Derbyshire limestone quarrying and cement production keep energy demand high relative to GVA.
Least energy-intensive in 2023 (lowest kteo/£1m GVA):
- City of London (0.002 kteo/£m GVA).
- Other central London boroughs dominated by high-value services such as Westminster (0.006), Tower Hamlets (0.007), and Camden (0.008).
- Outside of London/SE & E, Manchester (0.012), Edinburgh (0.012), Bristol (0.012) and Belfast (0.013) register low intensities relative to the other LADs in the periphery, reflecting diversified service-led economies.
In these high-value, service-dominated economies (finance, business services, government/knowledge roles etc.), output rises with only marginal additional energy use, resulting in low energy/GVA ratios.
Who improved the most and least since 2015?
We can look at change in two ways – absolute change (i.e. in the value of kteo/£1m GVA) and relative change (i.e. movement in the 2023/2015 energy use ratio).
Absolute change matters because it reflects where the largest reductions in raw energy intensity have been achieved.
Relative gains highlight a different group – areas that weren’t necessarily the most energy-intensive to begin with, but have transformed their performance proportionally
Improvers
Absolute improvers:
- Redcar & Cleveland (−0.405 ktoe/GVA) – by far the largest drop, tied to the closure of the SSI UK steelworks in 2015 and the gradual rebalancing of the local economy.
- North Lincolnshire (−0.106) still one of the most energy-intensive LADs, but efficiency gains have followed restructuring in the steel sector.
- Falkirk (−0.060) and Neath Port Talbot (−0.050), both heavily industrial, but energy use is edging downwards, partly due to decarbonisation investments.
- Pembrokeshire (−0.054) reductions linked to energy sector restructuring and efficiency gains in LNG and oil-handling facilities.
Relative improvers:
- Basingstoke & Deane (−67%) reflecting a diversified economy, with advanced manufacturing and service bases growing faster than energy demand.
- Rushmoor (−56%) defence and aerospace activity remains, but rental and leasing services lifted GVA relative to energy.
- Fermanagh and Omagh (-55%) likely reflecting strong growth in service sector GVA.
- Broadland (−45%) in Norfolk. reflecting the expansion of services and reduced relative weight of energy-demanding activities.
- City of London (−45%) illustrating that even service-heavy centres can become more energy-efficient over time.
- Redcar & Cleveland (−85%) – ranks as #1 but reflects a major structural shift in the local economy composition.
Deteriorators
Not every LA has seen improvement. A handful have become slightly more energy-intensive relative to their 2015 baseline. These increases tend to be small in an absolute sense and are typically linked to significant falls in ONS real output. Consideration of absolute and relative shifts yield largely the same set of LADs.
- Hart (+0.005, +36%) in Hampshire, Forest of Dean (+0.009, +26%) in the South West , Reigate & Banstead (+0.002, +19%) in Surrey. ONS GVA estimates suggest significant (>15%) falls in real GVA in each of these LADs since 2015 largely due to service sector contraction.
- Aberdeenshire (+0.008, +26%), the economy is partially tied to oil and gas activity, where fluctuations in output and prices can distort GVA-energy ratios. ONS GVA estimates suggest a 19% decline in real GVA since 2015.
POLICY TAKE
Policy needs to concentrate on those key industrial regions, the Midlands, the North, South Wales, and parts of Scotland which remain structurally more energy-intensive. These places sit outside of London and the South East, but are the core of any substantive national industrial strategy.
Without focus on these regions, the efficiency gap is likely to persist. It’s questionable whether market forces alone can address this issue. If policy is serious about clean growth and levelling up, then energy efficiency in these industrial areas has to be treated as both an economic and a social priority.
CONTACT US to discuss this data set or any other service.
NOTES, METHOD AND DATA SOURCES
Notes, Method and Data Sources
The analysis uses a number of ONS datasets
- Subnational total final energy consumption dataset for the UK 2005-2023, released on 31 July 2025.
- Subnational road transport fuel consumption statistics, 2005-2023, released on 26 July 2025
- Regional gross value added (balanced) by industry: local authorities by ITL1 region, released 17 April 2025
The energy measure includes all industrial and commercial fuel use, plus a proxy share of total transport fuel use derived from the road transport fuel consumption statistics. The proxy share is the proportion of fuel used by freight transport out of fuel consumption by all vehicles.
This total estimate of industry/commercial energy use in each year and each Local Authority District is divided by the corresponding total Gross Value Added (GVA). Chained volume measures of GVA are used in order to control for the effects of inflation over time. The measure is workplace based and therefore corresponds with the geographical allocation of industrial energy use.
Intensity use changes relative to 2015 are derived from a fixed effects regression model with period dummies, where the natural logarithm of the energy use per £1m GVA is the dependent variable. The model coefficients express approximate % change relative to 2015, controlling for the Local Authority’s starting point in 2015. Model coefficients relative to 2015 (t-value, estimated % = 0) are as follows: 2016, -2.8% (-4.3), 2017, -3.4% (-5.3); 2018, -3.8% (-5.9); 2019, -7.5% (-11.6); 2020, -1.9% (-2.9); 2021, -6.7% (-10.4); 2022 -11.3% (-17.5); 2023, -14.8% (-23.0). All coefficients are significant at 1% significance or better.