
HOW CLEAN IS YOUR LOCAL ECONOMY’S ECONOMIC OUTPUT?
In this analysis, we examine how greenhouse gas emissions produced directly by industry per unit of gross value added (GVA) vary across UK local authority districts between 2015 and 2023. This measure reflects how carbon-efficient local economies are, capturing where output remains emission-intensive and where technological or structural changes have reduced environmental impacts. Because areas differ sharply in their industrial composition, from manufacturing and logistics to finance and public services, the emissions-to-GVA ratio highlights spatial inequalities in both productivity and progress towards decarbonisation. Tracking this relationship over time helps to show whether economic growth is becoming less carbon-dependent and where targeted interventions, such as industrial electrification or low-carbon investment, could have the greatest effect.
Our interactive map allows you to explore how local carbon efficiency has evolved between 2015 and 2023. It highlights where economies have succeeded in reducing emissions relative to output, and where a strong industrial base continues to influence local emission patterns.
Data commentary along with method and data sources are set out below.
CONTACT us to discuss this analysis or any product or service.
COMMENTARY
What is the direct emission-intensity of generating £1m of Gross Value Added (GVA)? We examine the variation in direct emission generation per £1m of GVA across UK local authorities and explore how regional patterns have changed between 2015-2023.
Our chosen measure of the direct emission intensity of output is industrial and commercial emissions divided by real GVA, expressed as kilo tonne of CO2 equivalent , kt CO2e, per £1m GVA. The analysis provides a disaggregation of total greenhouse gas emissions into CO2 , CH4 and N2O emissions.
GENERAL TRENDS
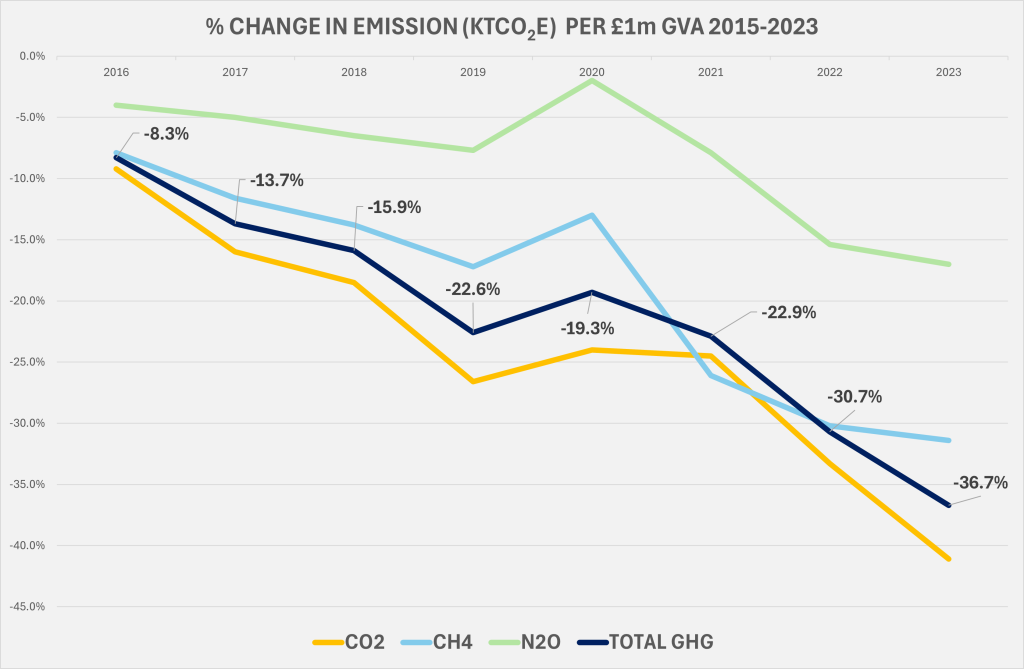
Average emissions per £1 million of GVA have fallen steadily since 2015, with carbon dioxide (CO2) showing the most pronounced reduction. Between 2015 and 2019, total greenhouse gas intensity declined by over 22%, reflecting continued decarbonisation of energy supply and improvements in industrial efficiency.
The temporary rise in 2020 corresponds to the pandemic period, when output contracted more sharply than emissions in some sectors, raising emissions per unit of GVA. As economic activity normalised, intensity resumed its downward path, reaching a 36.7% reduction relative to 2015 by 2023.
Disaggregated results show that CO2 intensity has declined faster than methane (CH4) or nitrous oxide (N2O), consistent with reductions in fossil fuel combustion and power generation emissions. By contrast, N2O emissions, largely associated with agricultural fertiliser and soil processes, have remained more persistent, reflecting the biophysical constraints on reducing such emissions.
Where is emission intensity per £1m GVA highest and lowest in 2023?
Local contrasts in greenhouse gas intensity remain striking across the UK. While most areas have seen steady improvement since 2015, the 2023 data reveal how deeply industrial structure continues to shape local carbon efficiency. Areas with heavy manufacturing or energy production report far higher emissions per unit of output than those dominated by high-value services.
Most emission-intensive in 2023 (highest ktCO2e/£1m GVA):
- Neath Port Talbot stands out with by far the highest emissions per £1m GVA (2.3 ktCO2e/£1m GVA), reflecting its concentration of heavy industry and steel production, among the UK’s most carbon-intensive activities.
- High Peak (1.66 ktCO2e/£1m GVA) and North Lincolnshire (0.97) also record high intensities, driven by energy- and material-intensive manufacturing such as chemicals, metals, and cement production.
- More rural areas such as Rutland (0.75), Powys (0.54), and Dumfries & Galloway (0.51) rank highly due to smaller local economies where agricultural and land-use emissions form a relatively larger share of total output.
Least emission-intensive in 2023 (lowest ktCO₂e/£1m GVA):
- The lowest-emission Local Authorities are dominated by London boroughs, reflecting the high value-added, service-sector orientation of their economies. City of London (0.007 ktCO2e/£1m GVA), Westminster and Islington (0.014), Tower Hamlets (0.016), and Camden (0.018) constitute the lowest five.
- Indeed, the lowest 20 areas are concentrated in London and the South East e.g. such as Brighton & Hove (11th, 0.025) and Reading (16th, 0.028).
- Outside this region, Edinburgh (19th, 0.031), Bristol (22nd, 0.032), and Bournemouth (24th, 0.043) register low intensities, reflecting the combination of low-emission and high value-added characteristics typical of knowledge- and finance-based local economies.
Together, these patterns underline how differences in industrial mix and economic density, not just regional policy, remain the dominant drivers of local carbon productivity.
Variation in Emission Composition Across Local Economies
Not all local economies emit the same mix of greenhouse gases. The composition of emissions varies sharply across the UK – CO2 emissions as a percentage of total emissions vary from around 95% to 18%, (mean 70.7%), reflecting differences in industrial activity, land use, and urban density.
- CO2 dominates in areas with energy generation, heavy manufacturing, or transport infrastructure, i.e. sectors that rely on fossil fuel combustion and process emissions. These account for most of the intensity observed in places such as Neath Port Talbot (95% CO2).
- CH4 (methane) is proportionally higher in rural and agricultural areas, particularly where livestock and waste management activities are significant contributors. Torridge (65%), Powys (61%), Dumfries & Galloway (53%), and several parts of Northern Ireland typically show higher CH4 shares.
- N2O (nitrous oxide) is more prevalent in agricultural and land-use emissions, reflecting fertiliser application and soil processes. Areas such as East Cambridgeshire (49% N2O) and Fenland (38%) have high N2O emission shares.
This variation in the underlying structure of emissions explains why some areas with similar total GVA can exhibit very different emission intensities. Local decarbonisation priorities therefore differ: industrial electrification and carbon capture may be appropriate in manufacturing regions, while agricultural or waste-sector reform appears more relevant in rural authorities.
Who improved the most and least since 2015?
Reduced Emissions per £1m GVA
The largest absolute reductions in ktCO2e per £1m GVA include:
- Redcar and Cleveland shows the largest absolute improvement, with emissions intensity down by around 2.5 ktCO2e per £1m GVA since 2015, consistent with the closure of major industrial facilities including steel production and chemical plants.
- North Lincolnshire (-0.86) and Neath Port Talbot (-0.63) also record major absolute reductions, reflecting efficiency gains and partial output shifts within energy- and material-intensive industries.
- Smaller, rural economies such as Rutland (rank 5, -0.25) and Fermanagh & Omagh (rank 8, -0.19) saw moderate absolute declines, mainly due to relatively small industrial bases where even modest emission changes translate to noticeable intensity effects.
Strongest relative improvers (% change from 2015) include:
- Redcar and Cleveland which again leads, with an almost 90% reduction in emissions per £1m GVA, illustrating how structural transition away from heavy industry rapidly lowers local carbon intensity.
- Several service-oriented areas such as Basingstoke and Deane (rank 2, -72%), Rushmoor(rank 3, -68%), and Hackney(rank 5, -61%) feature prominently, suggesting ongoing decarbonisation in mixed or commuter economies driven by lower industrial activity and improved building and transport efficiency.
- The former coal and manufacturing area Blaenau Gwent (rank 4, -63%) also shows one of the largest proportional improvements, reflecting post-industrial adjustment and a shrinking emission base relative to GVA.
Increased Emissions per £1m GVA
Some Local Authority areas showed marginal increases in emissions intensity between 2015 and 2023. These included:
- Mid and East Antrim which recorded the largest rise when considering both absolute and relative terms (+0.024 ktCO2e/£1m GVA; +10%). This was possibly linked to increased industrial throughput and/or shifts in fuel mix within local manufacturing.
- Aberdeenshire also shows a modest rise (+0.016; +7%), reflecting its exposure to oil and gas supply-chain activity, where emissions are sensitive to output fluctuations.
- Barking and Dagenham exhibits a relative increase (+14%), though the absolute change remains fairly small (+0.013); this likely relates to local regeneration and associated increased construction activity.
- Other Local Authorities such as Basildon, Stevenage, and Epping Forest show very minor changes (<0.005 ktCO2e/£1m GVA), consistent with normal annual variability or sectoral reweighting rather than a sustained upward trend.
Overall, increases are marginal and confined to a handful of areas, suggesting that the broad national pattern remains one of steadily improving carbon efficiency across the large majority of local economies.
POLICY TAKE
The evidence presented here highlights that local carbon intensity largely reflects the shape of the UK economy: industrial, service-based, and land-based areas each face distinct decarbonisation pathways.
For industrial heartlands such as Teesside, the Humber, and South Wales, policy momentum must continue through the Industrial Decarbonisation Challenge, the Carbon Capture, Usage and Storage Cluster Sequencing Plan, and Hydrogen Net Zero Investment Roadmap. Long-term certainty in Industrial Carbon Capture and Track 2 cluster funding is vital to sustaining output whilst reducing emissions per £1m GVA.
There’s a strong suggestion that service-oriented economies such as London and the South East, but also high-value cities beyond the core, such as Edinburgh and Bristol, should focus on reducing non-industrial emissions. Priorities include scaling up low-carbon heat networks, accelerating urban transport decarbonisation, and improving building energy efficiency. These are being advanced through initiatives such as the Local Net Zero Accelerator and successor schemes to the now-concluded Public Sector Decarbonisation Scheme, which laid important groundwork for future local-area retrofit and heat transition programmes.
Agricultural and rural areas will require tailored support through Environmental Land Management Schemes (ELMS), focusing on fertiliser efficiency, soil carbon management, and methane reduction.
Decarbonisation is therefore both an energy and productivity strategy, requiring regional, sectoral, and technological integration rather than a one-size-fits-all approach.
CONTACT US to discuss this data set or any other service.
NOTES, METHOD AND DATA SOURCES
Notes, Method and Data Sources
The analysis uses a number of Government datasets
- UK local authority estimates of greenhouse gasses dataset for the UK 2005-2023, released on 3 July 2025.
- Subnational road transport fuel consumption statistics, 2005-2023, released on 26 July 2025
- Regional gross value added (balanced) by industry: local authorities by ITL1 region, released 17 April 2025
The emissions measure includes all industrial and commercial emissions, plus a proxy share of total transport emissions by industry derived from the road transport fuel consumption statistics. The proxy represents the proportion of fuel used by freight transport out of fuel consumption by all vehicles.
Land Use, Land Use Change and Forestry (LULUCF) emissions are excluded because they are not directly related to GVA generation.
Emissions identified as ‘agricultural’ are included, though some components, particularly soil and fertiliser-related processes may only partially relate to measured GVA.
Emissions identified as ‘landfill’ and ‘other waste’ are treated as sources of local GVA.
The total estimate of industry/commercial emissions in each year and each Local Authority District is divided by the corresponding total Gross Value Added (GVA). Chained volume measures of GVA are used in order to control for the effects of inflation over time. The measure is workplace based and therefore correspond with the ‘at point of production’ geographical allocation of industrial emissions.
Indirect emissions e.g. through supply chains, are not considered.
The calculated emission changes relative to 2015 displayed in the chart are derived from a fixed effects regression model with period dummies, where the natural logarithm of the emissions in ktCO2e per £1m GVA is the dependent variable. The model coefficients express approximate % change relative to 2015, controlling for the Local Authority’s starting point in 2015. Model output is available on request.